The REPL Window/File#
The Calva REPL Window is actually a regular file with some extra treatment from Calva, like displaying a prompt, offering evaluation history recall and generally “following” the current namespace. This file is created and opened when Calva is connected to a REPL. You can use it for experimental code (though there are also Rich Comments and Fiddle Files for this).
In ClojureScript projects, the window will be associated with the cljs REPL once it is connected. It will then look something like this:
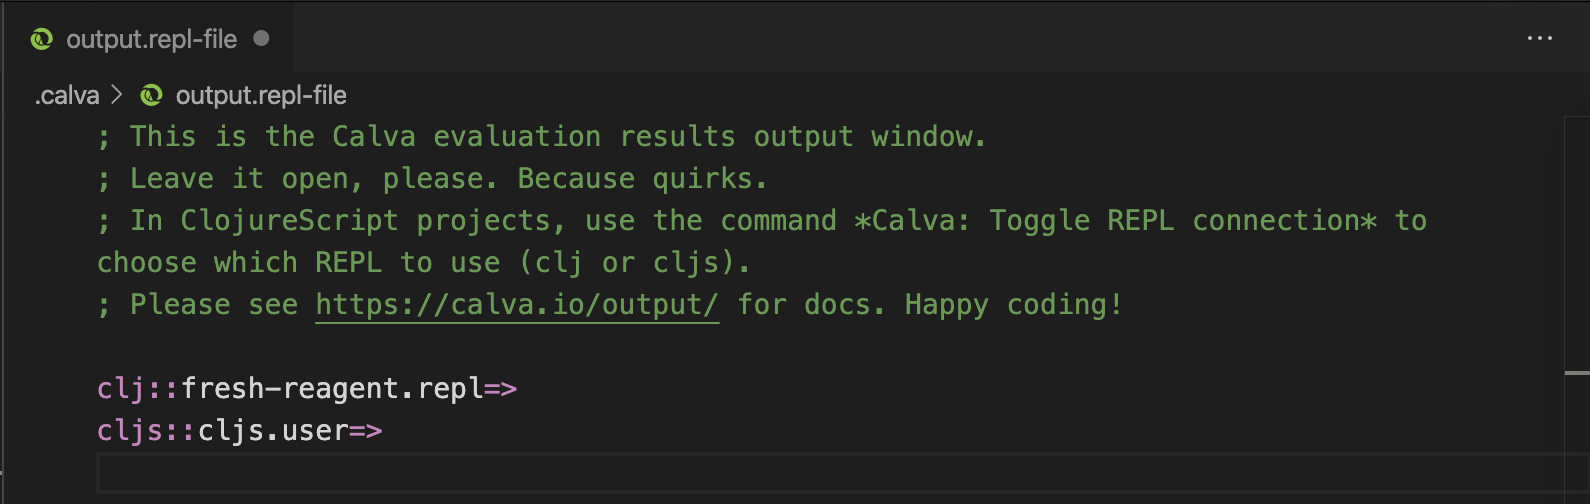
The first prompt is from when the clj REPL is connected, and the second from cljs. The first part of the prompt tells you which REPL type the window is currently connected to.
Using the REPL Window for output#
By default the REPL Window doubles as the place where Calva sends output like stdout/stderr and other messages. See Calva Output for more about this and how to change this behaviour.
If you want manual evaluations to also echo the code itself there, use the calva.evaluationSendCodeToOutputWindow setting.
Finding the REPL Window#
If you quickly want to open and/or switch to the REPL Window there is the command Calva: Show/Open REPL Window, ctrl+alt+o r.
To sync the REPL window namespace with the current file before switching, use the Switch Namespace of the REPL Window to Current Namespace command, ctrl+alt+c alt+n.
Find the File for the Current REPL Window Namespace#
When you are editing things in the REPL window, and want to open the file that defines its current namespace, use the Show File for the Current REPL Window Namespace command, ctrl+alt+o r.
Note
This also works for Clojure core and library namespaces.
Which .calve-repl file is the REPL Window?#
The first repl connected will determine the location of the REPL Window file. This file will be created at <project-root>/.calva/repl.calva-repl.
When opening/activating other .calva/repl.calva-repl files, potentially from earlier sessions when you have connected a different project first, Calva will pop up a message informing you about the possible mix-up. The message includes a button helping you find the real REPL Window.
Evaluating Code#
The window will be automatically associated with the REPL and the namespace of any project Clojure/ClojureScript file you evaluate code in. So for instance if you evaluate this code in a clj file with the namespace fresh-reagent.handler:
(def mount-target
  [:div#app
   [:h2 "Welcome to fresh-reagent"]
   [:p "please wait while Figwheel is waking up ..."]
   [:p "(Check the js console for hints if nothing exciting happens.)"]])
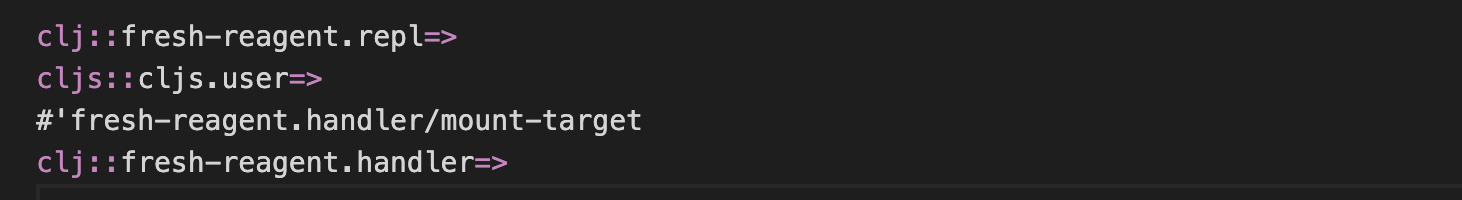
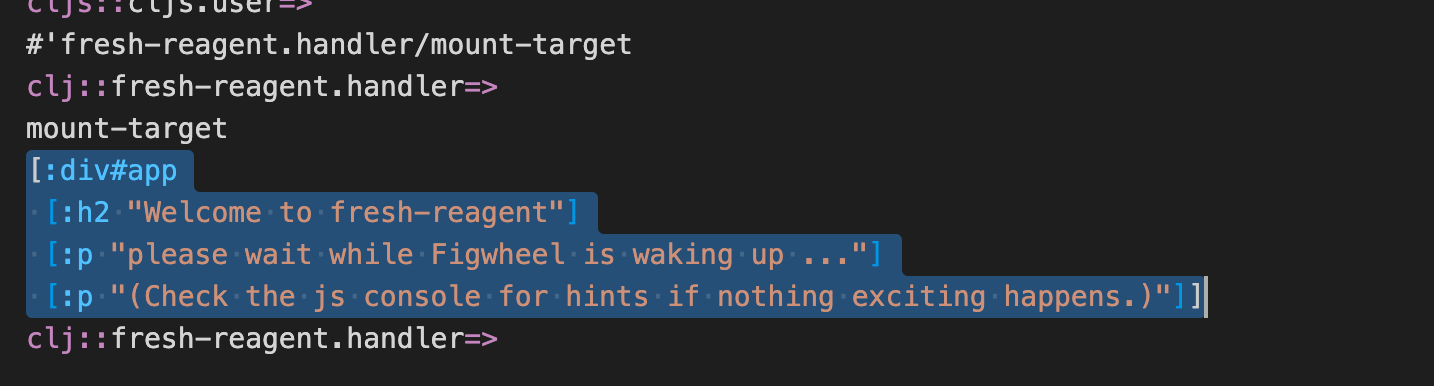
If the REPL Window is the configured destination for evaluation results, the defined var will be printed there. Otherwise, it will be printed to the destination you've configured. In either case, the REPL window will print a new prompt reflecting the current REPL connection and namespace:
If you then switch to the repl window (ctrl+alt+o r), and enter this at the prompt:
mount-target
then evaluate it using alt+enter, you'll get this:
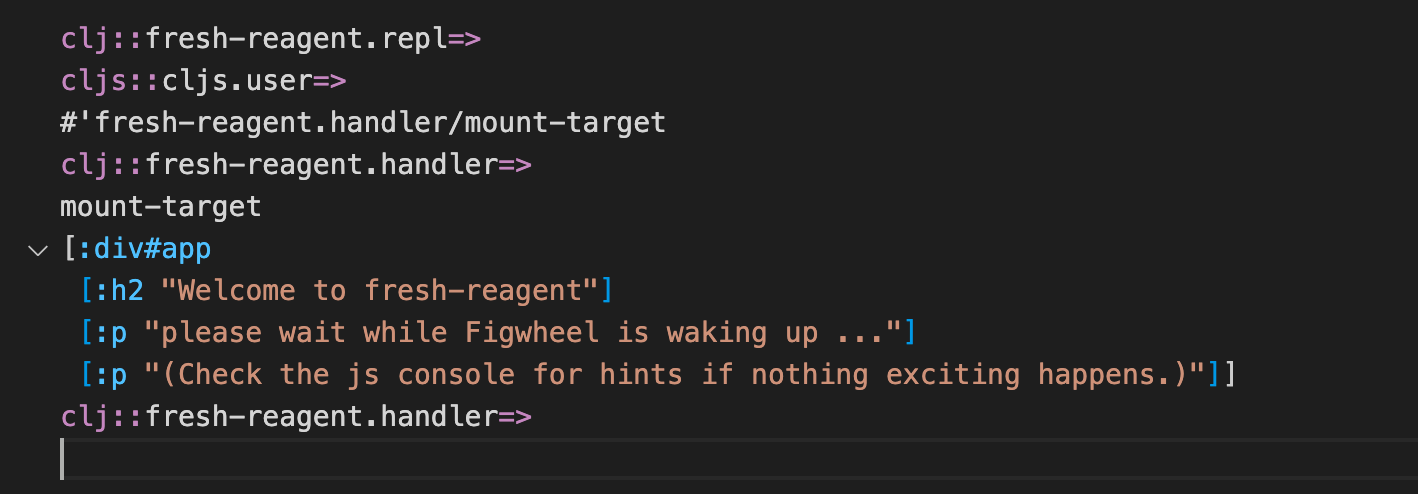
... because the namespace ”followed” the first evaluation in the REPL window.
REPL History#
Recently evaluated forms in the REPL file are persisted and can easily be shown again for modifying and re-evaluating.
Navigate REPL History#
You can navigate up and down the history of evaluated forms in the REPL file by pressing alt+up and alt+down, provided your cursor is at the end of the last form after the prompt. If the cursor is not at the end of the last form, then alt+up and alt+down will do whatever they are mapped to, which is by default "Move Line Up" and "Move Line Down," respectively.
If you have typed some text after the prompt before you start traversing up the history, this text will be preserved and will display when you traverse back down the history. If you modify some text in the history while traversing, the modification will be saved at that location in history.
Clear REPL History#
You can clear the repl history by running the command "Clear REPL History" from the command palette.
Stack Traces#
When an evaluation produces an error, it will automatically be printed in the REPL Window. If there is a stack trace associated with the error, it can now be printed on demand using the Calva: Print Last Stacktrace to the REPL Window command. You can also print the stack trace for any error message printed to the REPL Window via the Codelens button below it.

For printed stacktraces, when source locations are available (Clojure files), you will be able to navigate to them by pressing ctrl+click (cmd+click on Mac) on the file name. You can also hover over symbols in the stack trace to see the symbol's documentation, and ctrl+click (cmd+click on Mac) the symbol to Peek Definition.

Output destinations
If you have configured some other destination for stderr output, the error message will be printed there as well. But it will also be printed to the REPL Window, because the augmented stack traces need this (because reasons).
Load Current Namespace#
When navigating namespaces it is easy to forget to first require them and that can be tricky to debug. To help with this, Calva's command Load/Evaluate Current File and its Requires/Dependencies also works in the REPL Window, but there, it acts like Load Current Namespace.
Suppose you have two files, pez/xxx.clj and pez/yyy.clj, where pez.yyy requires pez.xxx.
(ns pez.xxx)

(def a :xxx-a)

(def b :xxx-b)
(ns pez.yyy
  (:require [pez.xxx]))

(def a :yyy-a)

(println "Hello" pez.xxx/a)
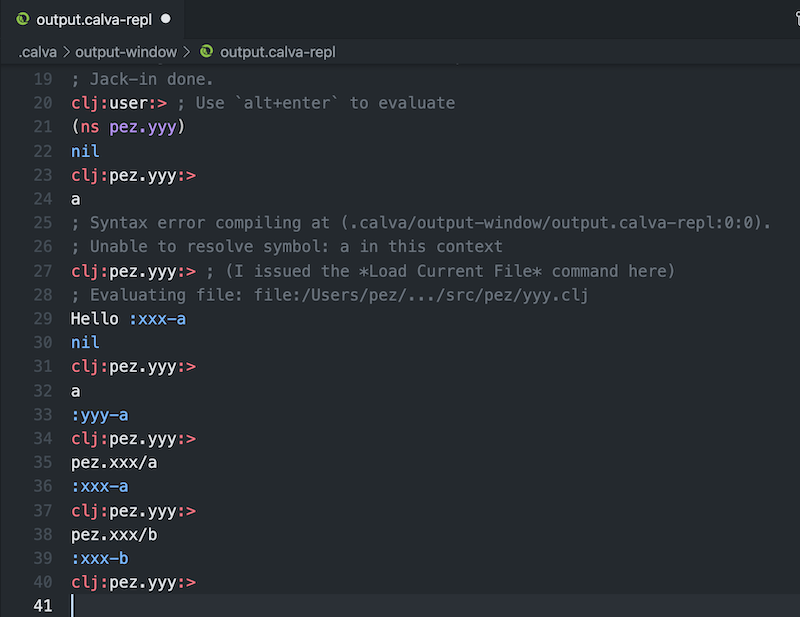
Then, with a freshly jacked-in REPL, you evaluate (ns pez.yyy) and want to work with the vars defined there, Clojure will complain. But if you Load/Evaluate Current File and its Requires/Dependencies, it will start working. Something like so:
Note
This currently suffers from a limitation in Calva where it won't reload dependencies, so you will sometimes have to do this ”manually” anyways (by opening the files and loading them yourself). See Calva issue #907
Peek Current Namespace#
A somewhat hidden feature: You can peek, see documentation for, and navigate to a namespace by hovering on the namespace symbol in one of the REPL Window prompts (just like you would if it was not in the prompt 😄).
Paredit Enabled#
The REPL Window is mostly a regular Calva Clojure/ClojureScript file, which makes everything that works in a regular file work in this file, including Paredit. This makes it easy to navigate the input and output there. For instance, to select the last evaluation results, you can press ctrl+w (shift+alt+right on Windows and Linux):
Debugger Enabled#
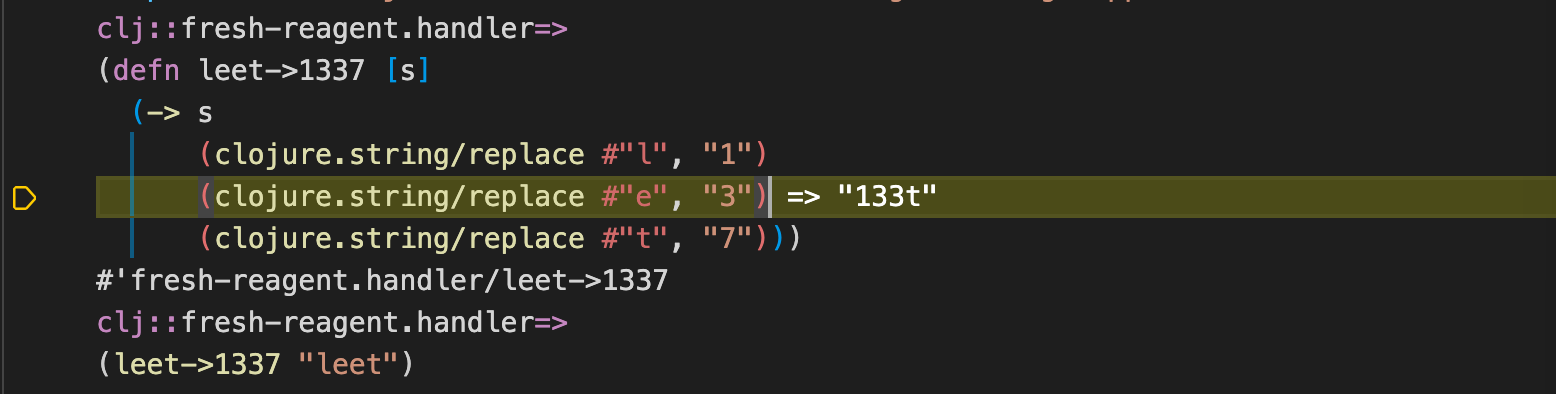
The repl window is mostly a regular... (you get it), which means you also have the Calva debugger at your command at the REPL prompt (only for clj sessions, for now). So instead of evaluating a function definition using alt+enter, you can evaluate it and instrument it for debugging using ctrl+alt+c i, and then call the function.
It is Ephemeral#
The contents of the REPL window is written to a file named repl.calva-repl in the .calva directory of your project root. The file is recreated every new session, so you should copy or save anything you want to preserve between sessions.
You probably want to add .calva/repl.calva-repl to your .<something>ignore files.
Choose CLJ or CLJS REPL Connection#
In multi-repl projects, the REPL window is treated as .cljc file.
Known Quirks and Caveats#
Due to limitations in the VS Code API it is hard for Calva to know if the REPL file is open, and if it was opened more than once. Therefore, we suggest you make it a habit to leave this window open, or even pinned. And if it is open in several tabs, expect evaluation printouts to be a bit unpredictable.
If you save the REPL file (which most often does not make much sense, but anyway) you will sometimes be presented with a message about VS Code being confused about the file contents being out of sync. Just choose to Overwrite the currently saved version and you should be fine.